How to analyze Survey Data with your Survey Software?
Jun 21, 2021
iCrowdMarketing powered by iCrowdNewswire

It is again the time to collect customer feedback. Customer Survey is essential for every organization to plan the future course. However, it is not only challenging to collect feedback but also to analyze the data.
Your Survey Data cannot analyze itself. You need a team of dedicated employees who can operate through your Survey Software and provide you with insightful reports. You need a report that can provide you trends and customer behaviors for your sales, service, and marketing strategy.
Here is the guide you can refer to, learn how you can analyze your survey data.
Survey Analysis
When you analyze the data collected from a customer survey or any other survey, the process is called Survey Analysis.
The reason you need to analyze your collected data is that without analysis the numbers mean nothing. You need to understand and attach significance to those numbers to help you improve your business and achieve your goal.
Why should you use Survey Software?
Using Survey Software is especially helpful when you are dealing with a large volume of data. The automatic process can help you analyze a large amount of data in no time. Additionally, the survey software provides other tools and features that can be of advantage.
The traditional method of analyzing data was prone to human error, as well as subject to bias. The error and bias further lead to unreliable data. This means more time and effort spent on re-analyzing the data. Moreover, you have to invest more in human resources.
Before you begin analyzing the survey data, you need to understand the types of survey data and four levels of measurement.
Types of Survey Questions
Close-ended questions
These questions can be answered with a simple “yes” or “no”. Or, give the respondent a list of options to choose the answer from. A close-ended question allows you to segment respondents based on their responses.
Open-ended questions
With these types of questions, respondents are allowed to give their insight and opinion. The responses are objective and qualitative.
Four Level of Measurement
Nominal Scale
The data collected on a nominal scale have no quantitative value. “Your favorite brand of shoes” is an example of a nominal scale question. You can track the option which was most selected.
Ordinal Scale
It depicts the order of the values and is quantitative. One value is higher than the other. Ordinal scale data can be analyzed through cross-tabulation.
Interval Scale
It depicts the difference between two variables and also the order of the values. There is no true zero-point, but the interval remains the same.
Ratio Scale
It also depicts the difference between variables and the order of values. But, there is a true zero point on the Ratio Scale.
How to analyze Survey Data? Top research question
You must have a goal of conducting this survey, and for the goal, you must have set out the main research question. Go back to the research question and then look at your survey questions. Segment those survey questions which have a direct impact on the answer of the main research question.
Let’s say your purpose is to know “How your customers rate your Company?” Such questions like “How likely are you to recommend” impact the main research question.
Cross-Tabulation
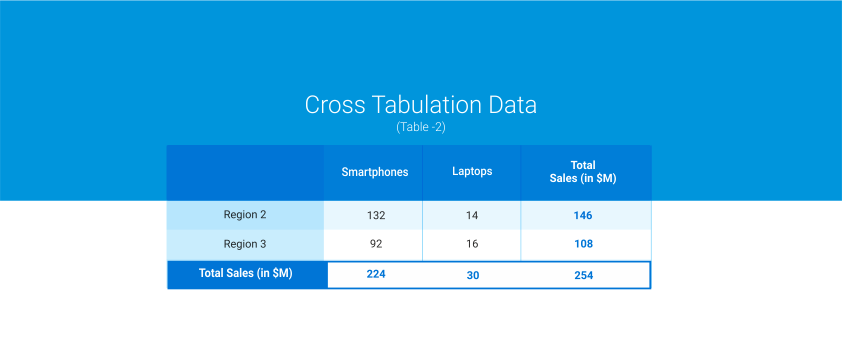
Cross-tabulation is a tool you can use in your survey software. It helps understand the relationships between two or more survey questions. For example, with cross-tabulation, you can record the relationship between gender and the purchase of your product.
This way, you can narrow down your survey data to specific groups and analyze how your target market responds to your survey.
Statistical Significance
Statistical significance implies that your results represent your targeted market. This shows that your survey data is meaningful and valuable.
Let’s say your target customer is 20 to 25 years old. 40% of your audiences say they will purchase again from your brand, but 70% are above 45. The survey data is not significant in this case.
When you run data analysis in your survey software, it will tell you if your data point is statistically significant.
Compare current data with past data
Comparing your current data with your past data is always an excellent way to see how much you have improved compared to the last survey results.
If this is your first survey, make the survey data your company benchmark to compare it with the next analysis. By comparing new data with the old data, you can track changes over a regular interval. It can help you identify where you need to work the most to have better results.
Sample Size
It is impossible to collect feedback from all of your customers. However, to ensure that your survey data is reliable and represents your target market, you need a large sample size.
You can use your survey software to calculate the survey size you need before you begin your survey. This way, you can gather meaningful data for analysis.
Also, keep in mind that your sample size is representative of the entire population. So, you need to decide the margin of error you are comfortable with.
When using survey software to analyze your survey data, make sure it is the right tool for you. The software you choose should be reliable. It should have all features that can provide you with easy and fast analysis. Moreover, you should be able to optimize the survey software to your needs.
Tags: English