How to Create a High-Quality Infographic for a Term Paper
Dec 10, 2021
iCrowdMarketing powered by iCrowdNewswire

To write a term paper or thesis, students do research, collect and provide a lot of information. A simple way to display data compactly and is to do it with infographics (diagrams, charts, etc.)
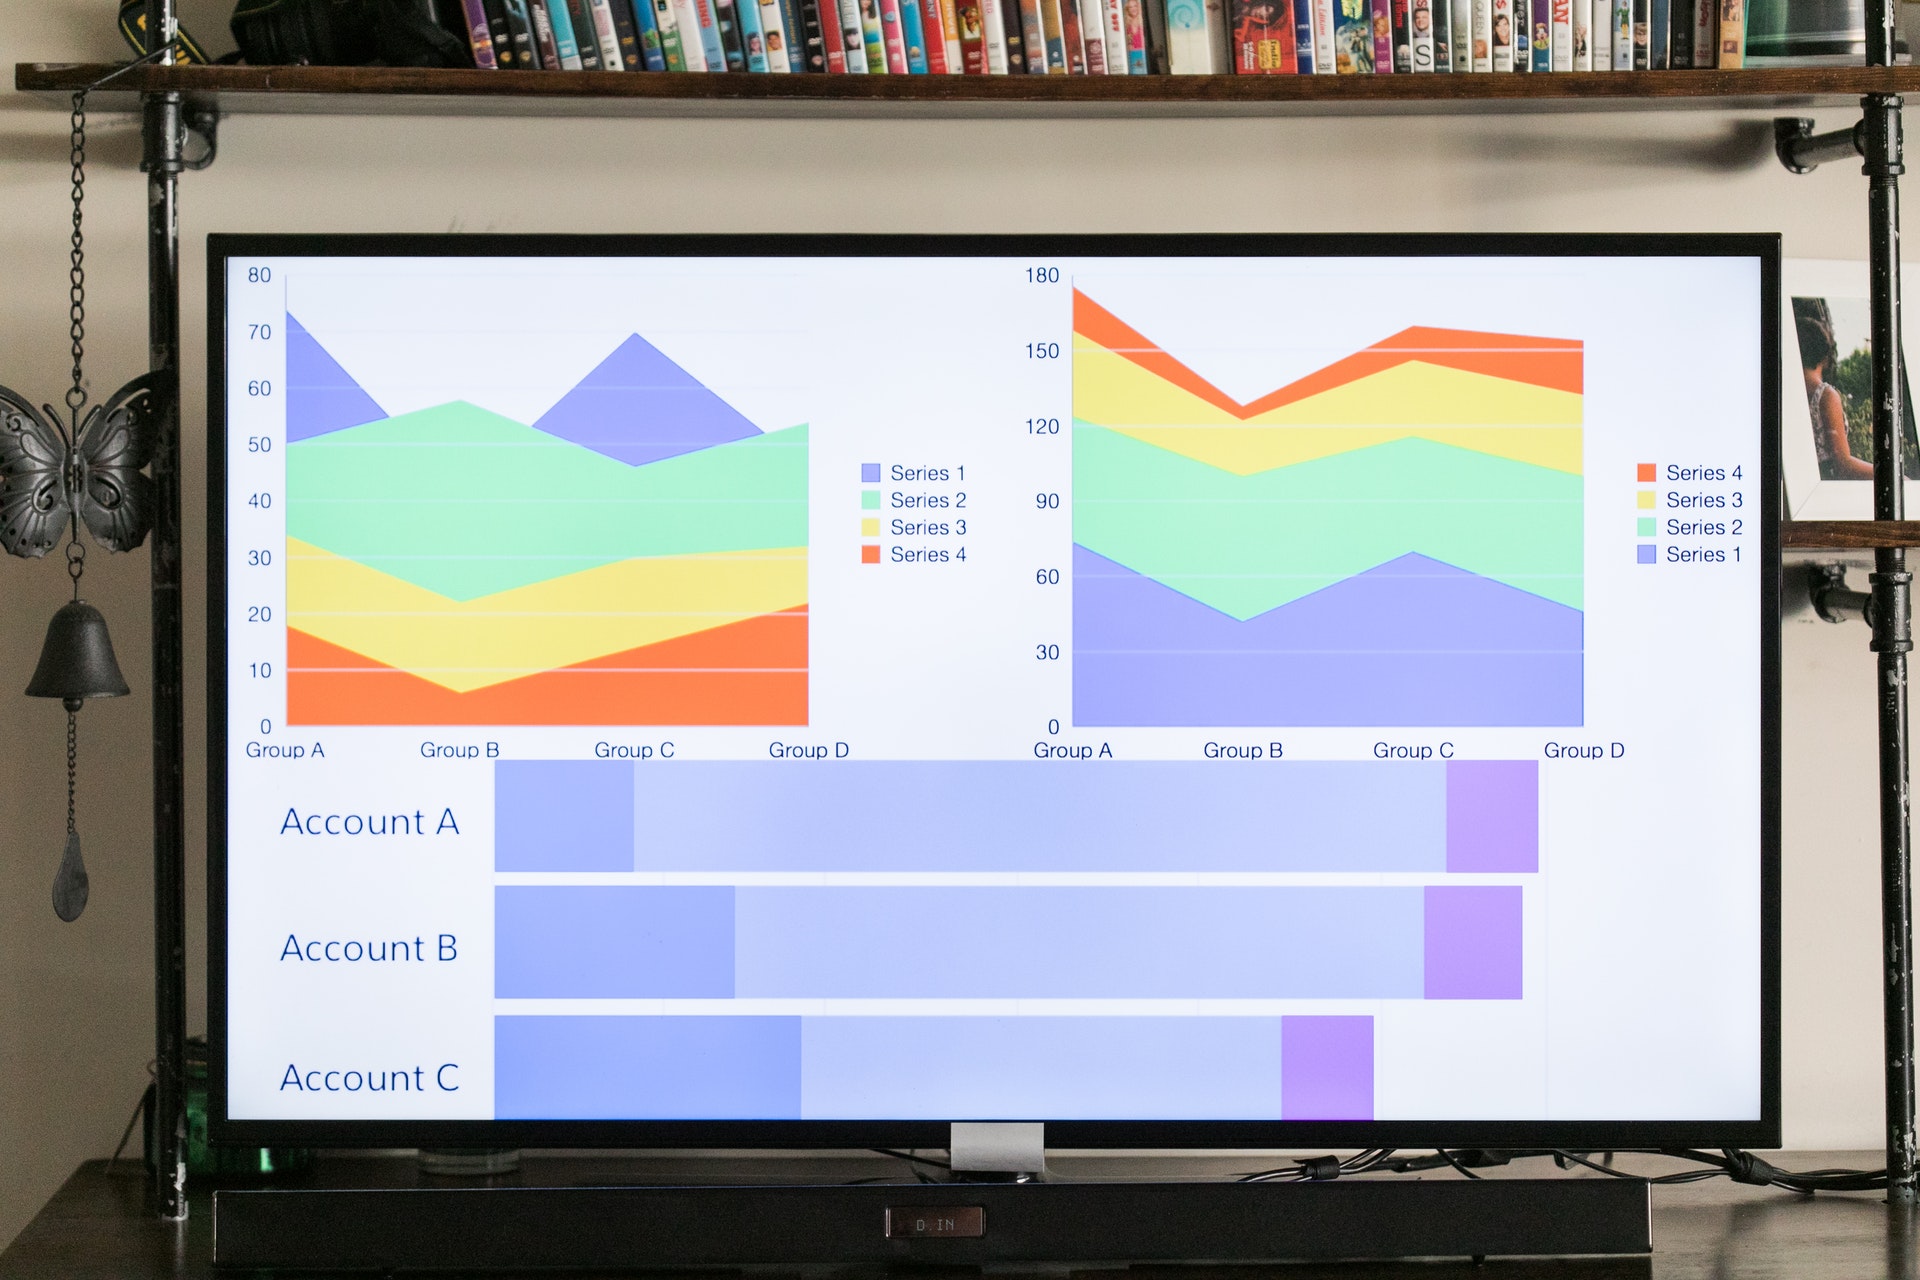
Infographics are a way to visualize data. You convey complex digital data in simple, understandable language of graphics and instead of boring columns of numbers, you get an informative lively narrative report.
Below we will tell you about useful online services that will help you create infographics for free if you decide to write your paper or a thesis on your own. Anyway, using those services might be useful not only for your academic assignment so let’s take a look at them.
Infogram
Service with a user-friendly laconic interface. There is a trial period and different rates, including free. It is easy to work with it: you choose a design, load data, correct schemes, add maps, videos, or pictures.
The free plan has more than 30 types of charts, 4 types of graphs, and 7 ready-made templates for infographics. You press the Design button and edit explanations, headings, add photos or change the color of elements in the graphic. After publication, you place the infographic on your resource (including social networks, website). You don't need to know how to program or design to work in this service. With one click of a button and the result looks aesthetically pleasing and clear.
Piktochart
An app with a large built-in collection of images and templates, even in the free version. You can create presentations, reports, banners, infographics even if you didn't go to art school. The app has many paid and free templates that you can edit to suit your project.
The site has an informative section for students with a detailed guide to working with Piktochart and a free course on the basics of visual storytelling. These tools will help you compose your report competently.
There are 12 free templates available in the Infographics section. The free rate allows you to upload a map or YouTube video. The service is available on the desktop and in the app (IOS and Android).
Canva
Service with a wide range of graphic capabilities. It is enough to read the reviews to understand that this is a quality product. Great for average users. There are many ready-made templates in which you can edit layers, styles, text, insert images, videos and charts. The whole interface is straightforward.
The main advantages of the service - the ability to create GIF-animations, set the transparency of elements, work in teams on a project in real-time, and export the result of the work in PNG, JPG, PDF, MP4, etc.
To create an infographic, select the "Infographics" template and fill in the necessary data. There is a trial period and a completely free version is available.
Create
Service for creating flowcharts, relationship maps, KWL tables, and so on. There are many schematic tools and ready-made solutions to quickly make various flowcharts, many kinds of diagrams (UML, SWOT, network, Venn diagrams), relationship maps, KWL tables, organizational structures, etc.
There is a function of teamwork on the same project in real-time, the ability to leave comments on the project and share them. An online shared host is available where you can learn at a 50% discount, share ideas, and learn from other students. Click "For Education" and get your discount.
Visme
A visual workshop with a clear interface for creating presentations, reports, animations, infographics, and so on. The main control panel is located on the left. You click "Create", choose a theme from those offered, and then a suitable layout option.
The service has many templates, including animated icons and various special effects. There are several rates: free with reduced features, a trial for the first project, and others.
There is a 50% discount for students. That means the fee for the semester will be $20. You'll have 250MB of free space and premium templates, graphics, and widgets. You will be able to create up to five projects and download the finished project in JPG, PNG, PDF formats.
Easel.ly
A great option for beginners with a minimalistic interface. There are affordable rates (from $5 per month), there is a 50% discount for students. It works only with static images.
This service is used when you need to quickly create simple infographics without unique designs. There are 15 free templates with different substrates. In the free version, you can create infographics without registration and save the result in JPG and PDF format without service logos.
Venngage
Multifunctional service for creating infographics, presentations, banners, flowcharts, maps, reports, and so on. The free version has more than 10 ready-made templates, icons, and photos. In the built-in photo editor, you can change images beyond recognition - the photo editor has cool features.
The limit is five infographics, but you can edit them endlessly for a new project. You can only publish your finished infographic online - you can't save it to a smartphone/computer/laptop or send it to email.
There are helpful articles for students on the Venngage website in the Learning Center section with tips on data visualization, theory on types of infographics, and tips on how to write a resume.
We've offered services that an untrained user can quickly figure out. All services are user-friendly - you have no problem learning how to use them. The free version is enough to write a long-term paper, and enrich it with cool infographics so that some even might think that your paper was written by a professional paper writing service with help of a designer.
Infographics illustrate and supplement your research in your term or thesis. If your paper has clear graphs, tables, or other images, your chances of getting a top grade increase dramatically.